
● Carbon Engine · early access
Carbon accounting your team can actually use
Scope 1, 2 and 3 for small and mid-sized businesses, built first for logistics and real estate. Add data by hand or upload Excel, see the math behind every number, and plan reductions with the same engine.
Try the live demo with a sample company (no sign-up) · Already have an account? Sign in
Free during early access · GHG Protocol · ISO 14064-1 · IPCC 2006 · AR5/AR6
Total · t CO2e
0.0
Scope 1 · t CO2e
0.0
Scope 2 · t CO2e
0.0
Scope 3 · t CO2e
0.0
Biggest sources
Emission factor that will be used
2.718 kg CO2e per litre
Diesel, company vehicles · IPCC 2006 · AR5
Live numbers from the engine, run on our fictional sample logistics company.
Everything in one place
Built for the people who collect the data, not only the people who read the report
Guided entry by scope
Pick Scope 1, 2 or 3, then what produces the emissions: company vehicles, generators, refrigerant leaks, electricity, transport, tenants. Plain words, the right units only.
Excel and CSV upload
Download the template, fill it in Excel, upload it. Every row is checked and calculated before import, and problem rows are explained.
The math behind every number
Formula, factor value, gases and source on every line. You see the factor before you save, not after.
Data-quality score
Each line scored from 1 (supplier-specific) to 5 (placeholder), plus an emissions-weighted score for the whole footprint, so you know what to improve first.
Targets and scenarios
A 1.5°C pathway from your base year, and levers you set (fleet fuel, renewable power, refrigerants, tenants) recalculated by the same engine.
Sites, years and intensity
Split by site or business unit, keep one inventory per reporting year, and track kg CO2e per tonne-km or per m².
Saved per company, with an admin view
Each organisation’s data is private to its members. Owners, editors and viewers. Totals are recalculated on our server at every save.
Assistant that never changes your data
Explains your footprint and turns messy rows into activities with a confidence level. Nothing is added until a person approves it.
API and Python engine
The same calculations through a REST API, and a dependency-free Python engine you can run in your own infrastructure.
A designed sustainability report
Track energy, water, waste, people and governance next to your emissions, and get a designed VSME report with year-on-year change, ready as a PDF. CSRD, ISSB and SECR tables included.
Supplier data requests
A ready email and one-line template for each haulier or contractor. Upload what comes back with the importer.
Evidence and year-on-year
Attach an invoice or meter reference to every line, edit any entry with a logged change, and compare each year with the last.
Light or dark
A dashboard you will want to open
One click on Dark in the top bar switches the whole app. Your totals, charts and sources glow in clear colours, so the biggest number is always the first thing you see.
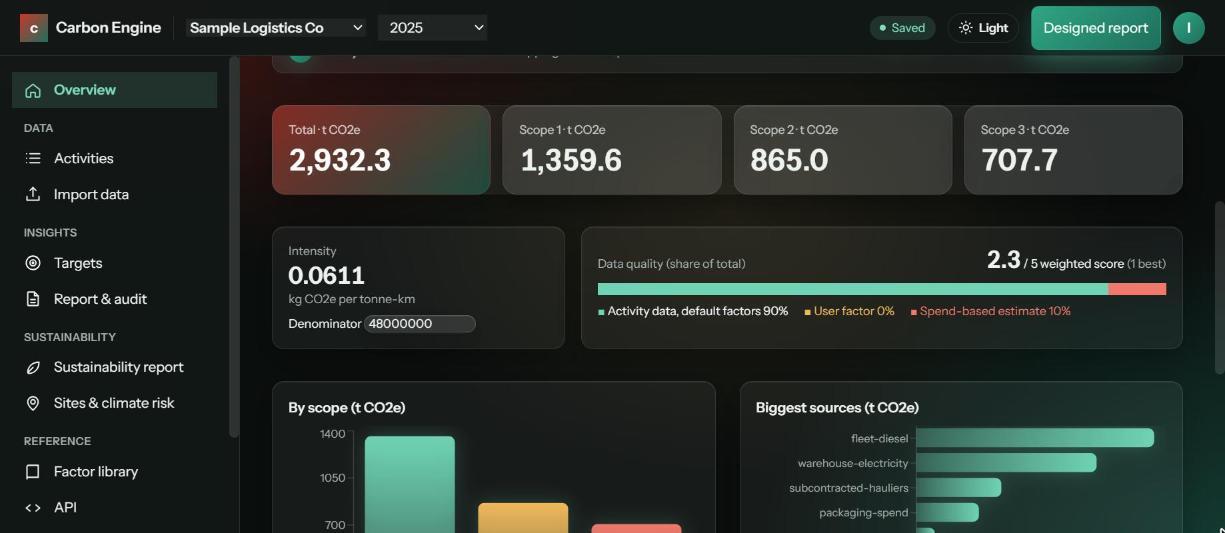
Sample company data. The light look is the default.
Made for two industries first

Transport and logistics
- ✓Own fleet fuel in litres, by vehicle type
- ✓Subcontracted hauliers in Scope 3 (fuel or tonne-km)
- ✓Warehouses, cold stores and refrigerants
- ✓Intensity in kg CO2e per tonne-km

Real estate and buildings
- ✓Common-area electricity, chillers and generators
- ✓Tenant energy in Scope 3 category 13
- ✓Renewable PPAs, reported market-based
- ✓Intensity in kg CO2e per m²
See it step by step
The full walkthrough, click by click
- 1Sign up and name your company
- 2Follow the getting-started checklist
- 3Add data by scope, or upload Excel and request supplier data
- 4See the math and evidence behind every number
- 5Set a 1.5°C target and test reduction levers
- 6Track water, waste, people and governance (VSME)
- 7Request climate-risk maps for your sites
- 8Open a designed sustainability report and download the PDF
Narrated by Zarmina, climaRevolt’s AI guide. Real screens from the app, using a fictional sample company.
How it works
From bills to a reportable footprint in three steps
- 1
Create your organisation
Sign up, name your company and choose the reporting year.
- 2
Add your activity data
Type it in with the guided form, or upload your Excel sheet. Fuel cards, electricity bills and contractor reports are enough to start.
- 3
Read, improve, report
See your footprint by scope, site and source, raise data quality, set a target and download the report with its audit trail.
Numbers you can defend
- ✓Every factor cited. IPCC 2006, AR5/AR6 and national grid data, with the source shown next to each result.
- ✓Server-side totals. Totals are recalculated on our server at every save, so stored figures always match the data.
- ✓Private by design. Spreadsheets are read in your browser; each organisation’s data is visible only to its members.
- ✓Your infrastructure if needed. The Python engine runs anywhere, for teams that must keep data in their own country.
Measure your footprint this week
Free during early access. Bring last year’s fuel and electricity records.